Exploring Your Data
Every study in Biowatch opens with the same six tabs. This guide walks through each one, using studies imported from the demo dataset, GBIF, and LILA.
Overview
The Overview tab is the study's front page: title, description, and contributors at the top, a satellite map of camera trap locations, a band of key metrics (species, deployments, time span, observations, media), the best captures from the study, and the full species distribution with IUCN conservation status badges.
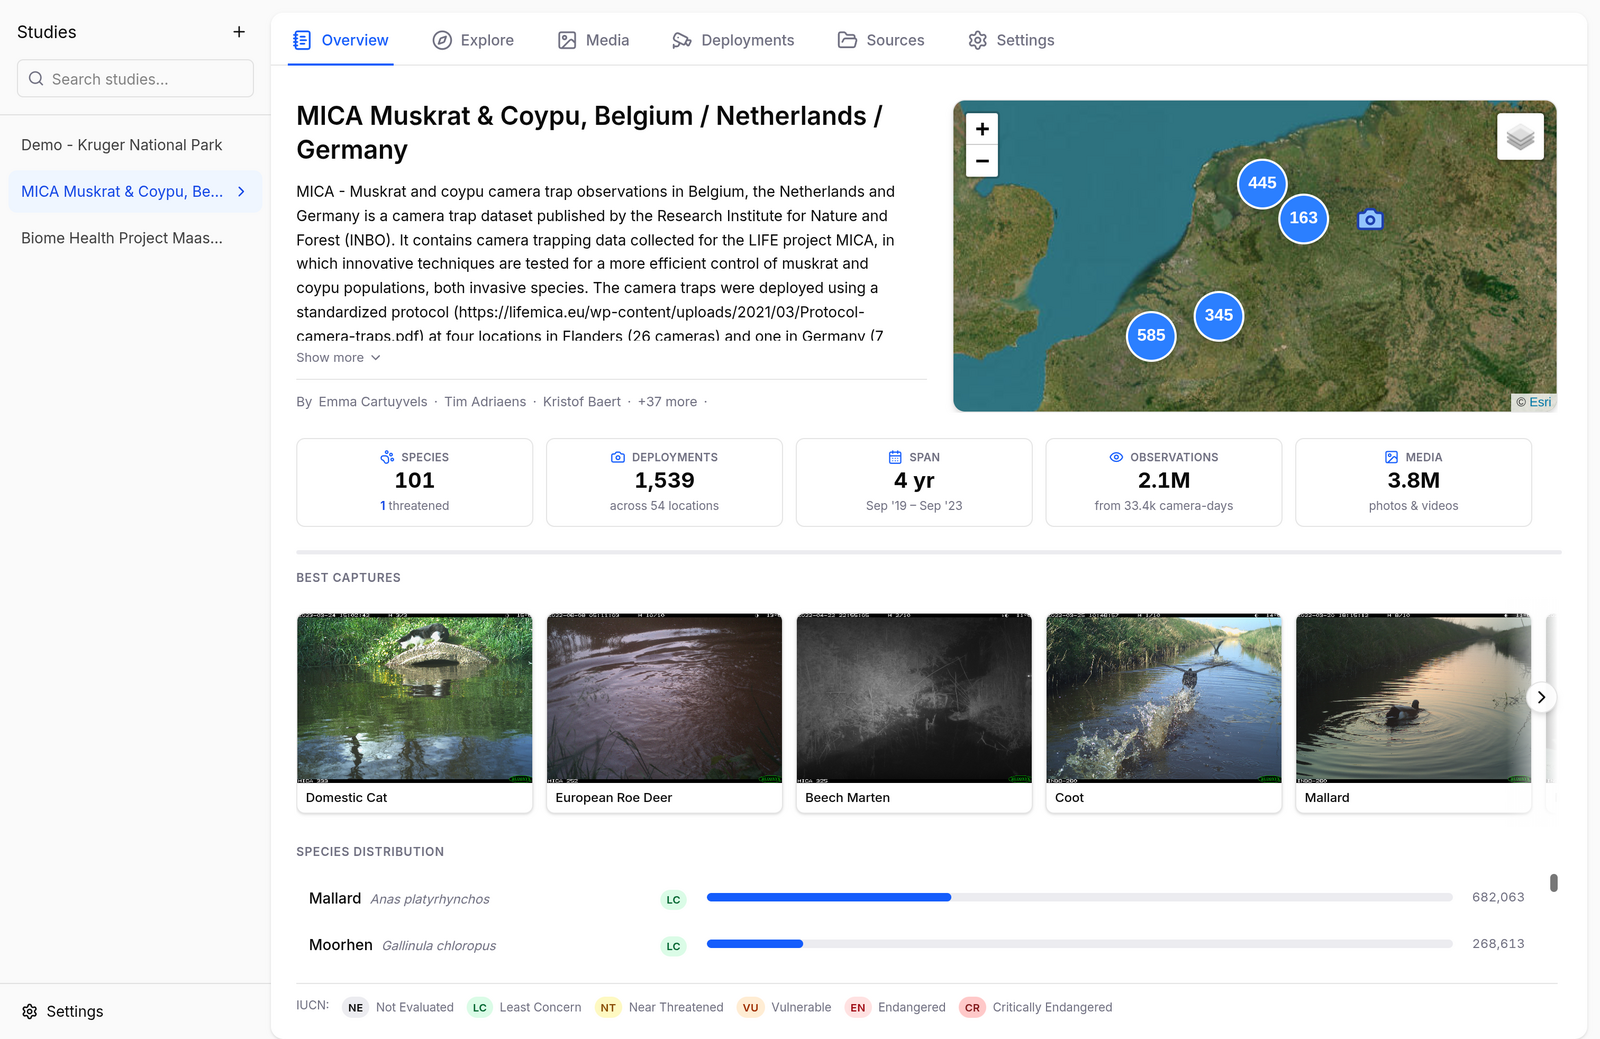
Studies imported from LILA highlight their featured species with representative photos:
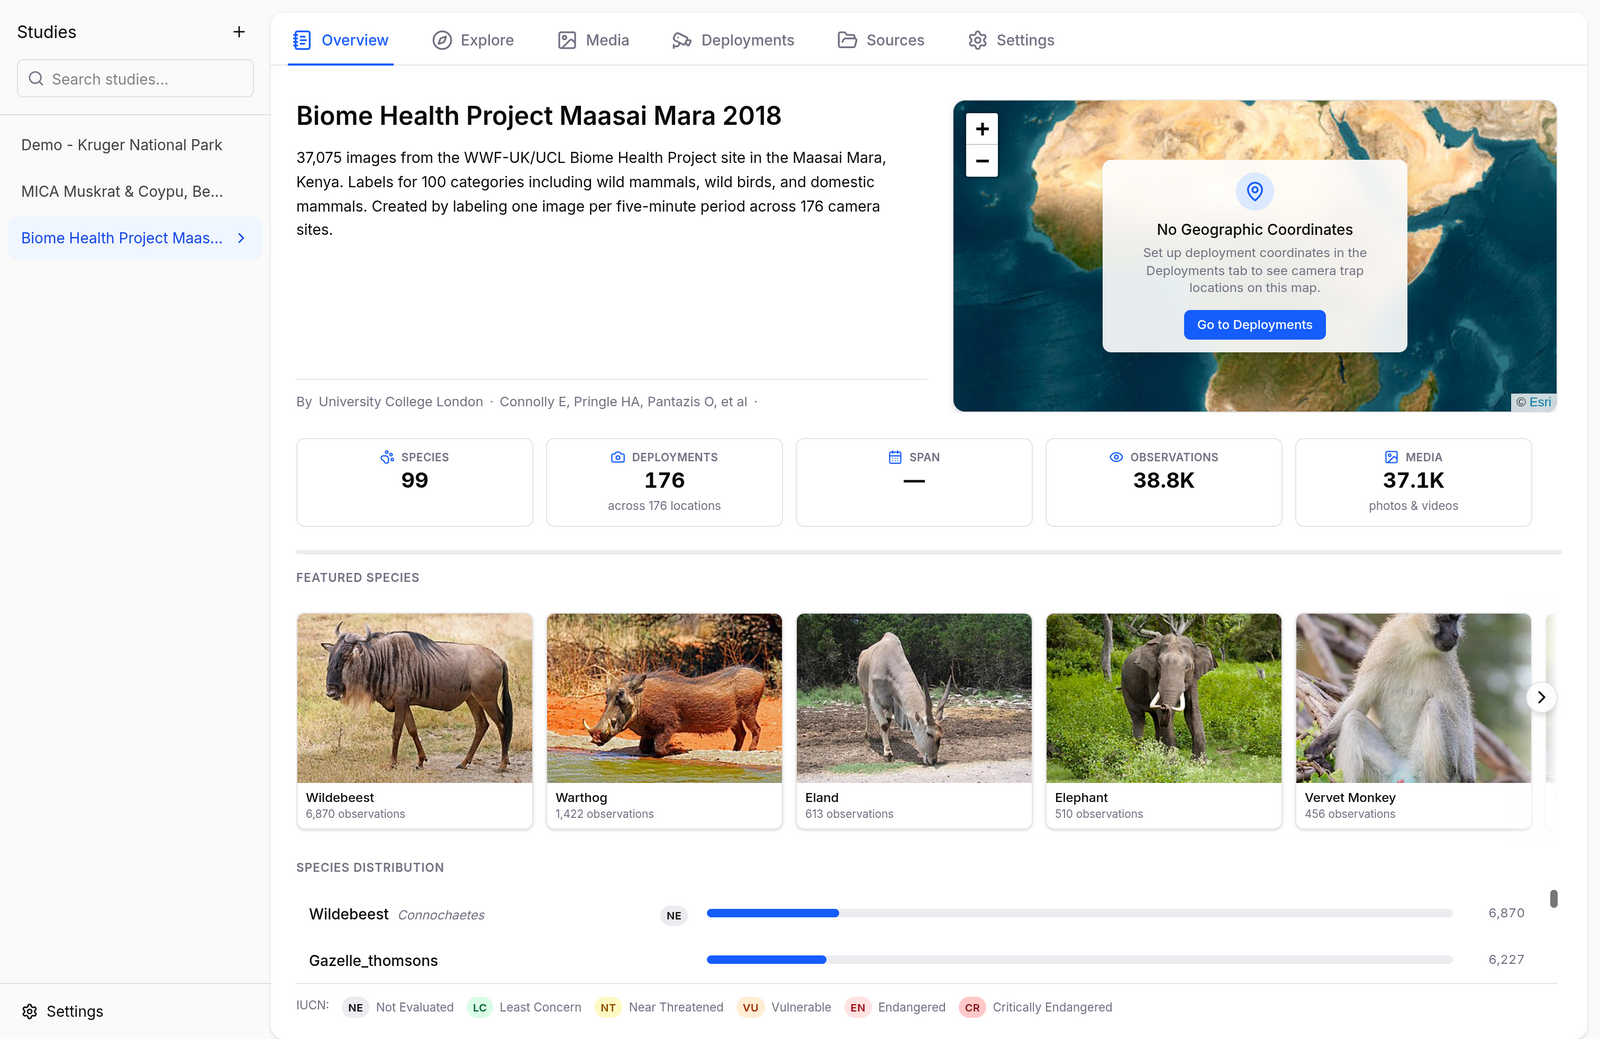
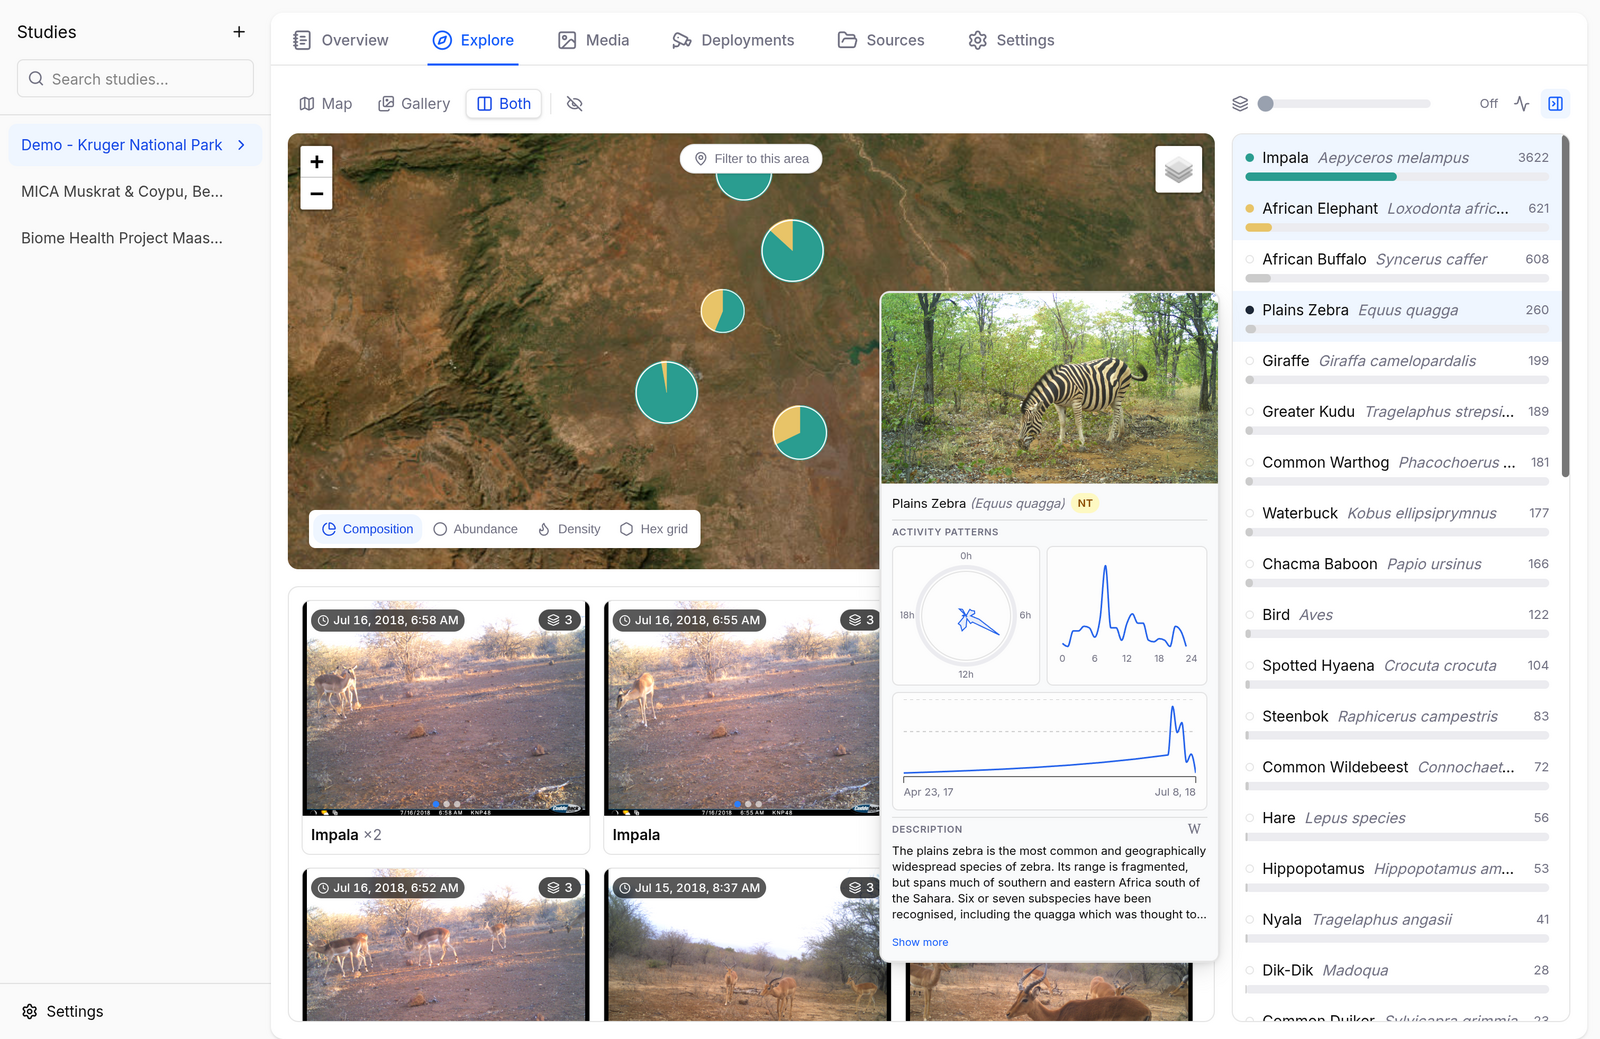
Hover over a best capture (or any species name across the app) to get the species hovercard — photo, description, and a link to the IUCN Red List assessment:
Explore
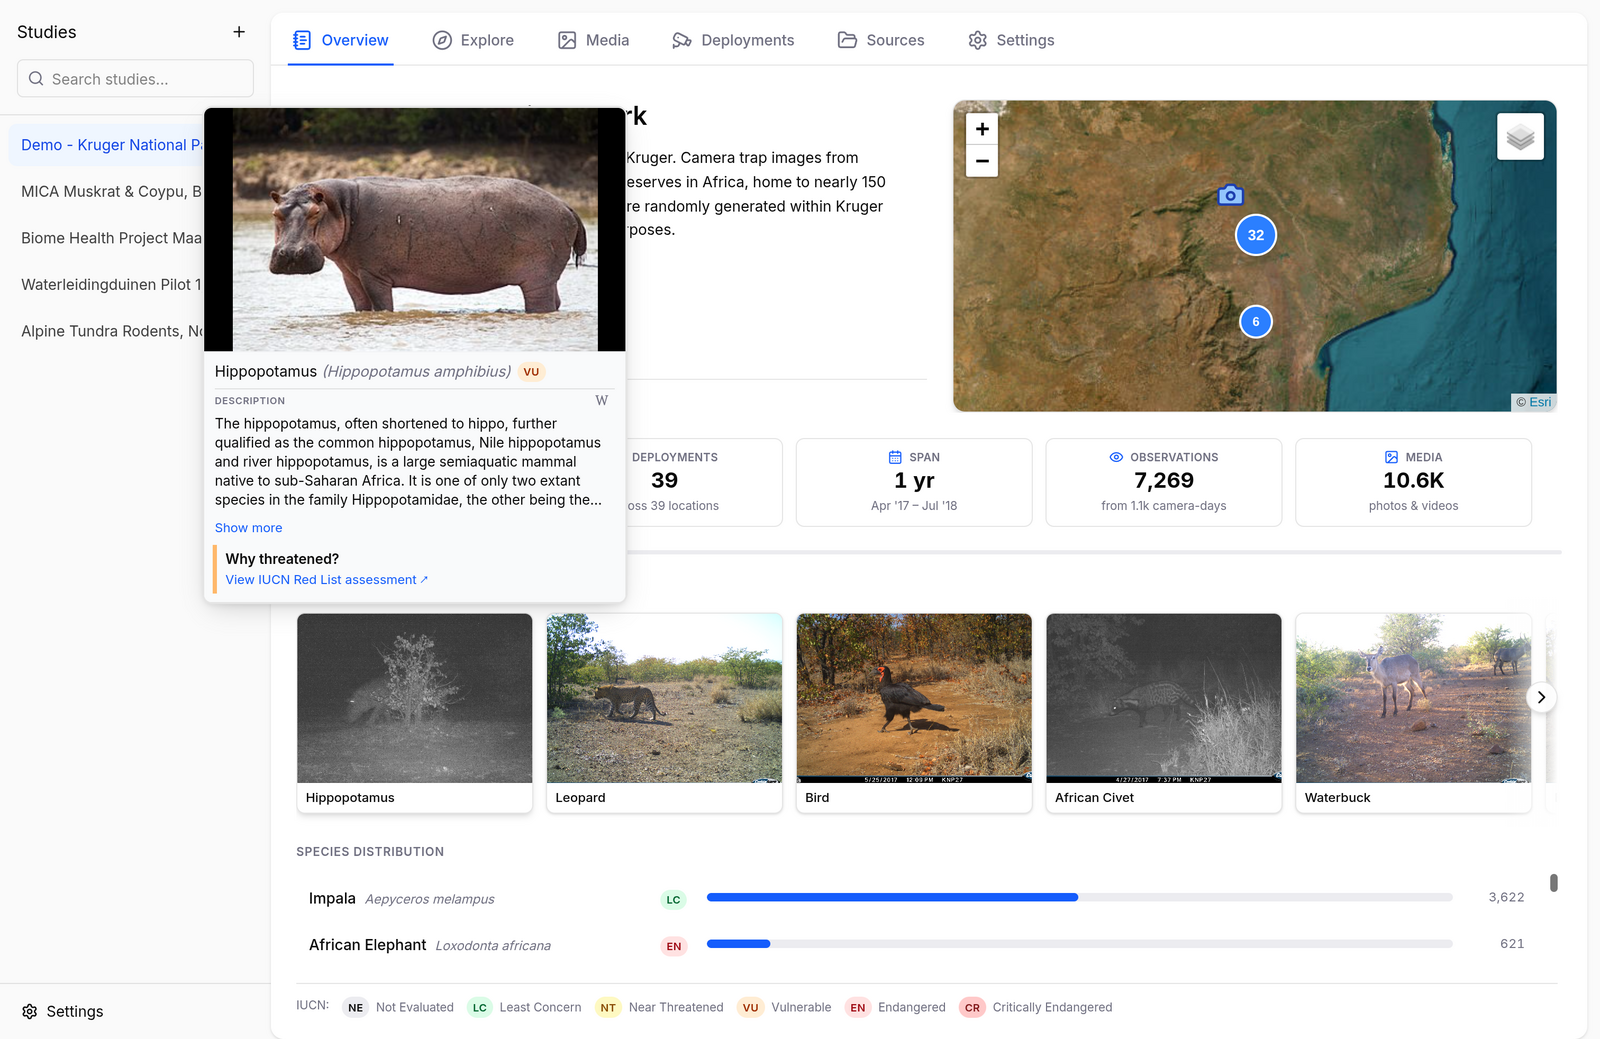
The Explore tab is where the analysis happens. It combines three views you can toggle between — Map, Gallery, or Both — plus a species rail on the right.
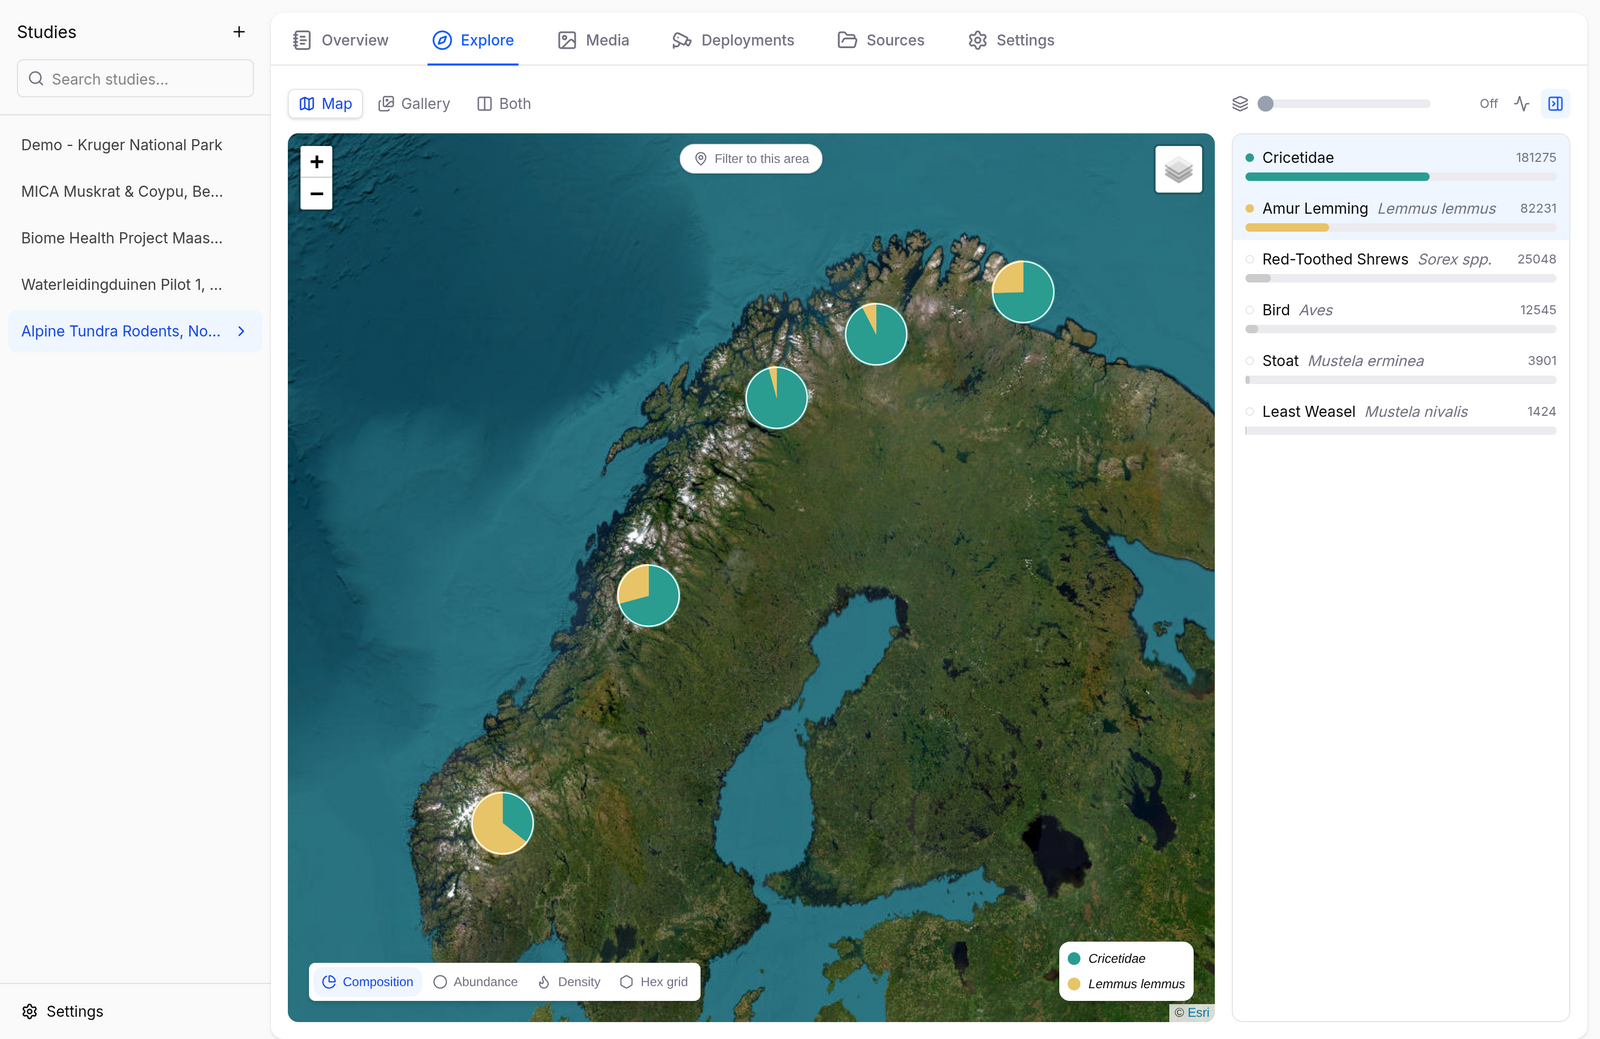
- Species rail — every species in the study with its selected analysis metric. Click species to select them; each gets a color used consistently across the map and charts. Choose N ind., N obs., RAI ind., or RAI obs. to switch the counting basis and optional camera-effort normalization. The slider at the top controls sequence grouping, so bursts of photos count as single events.
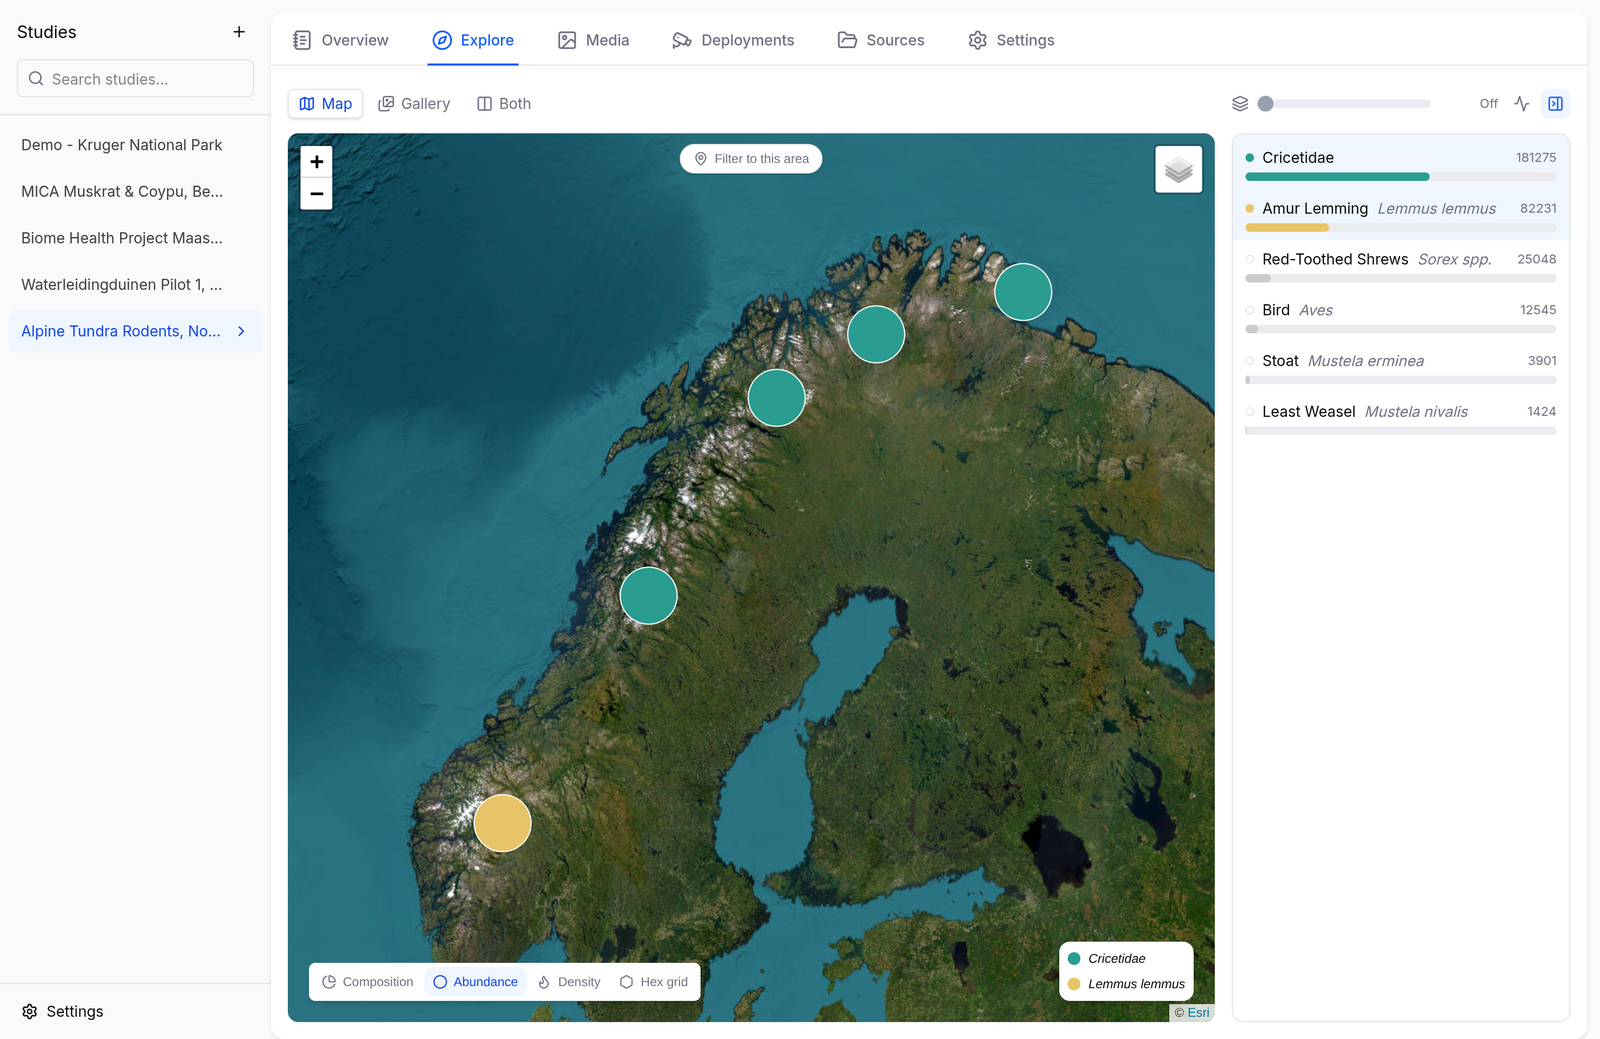
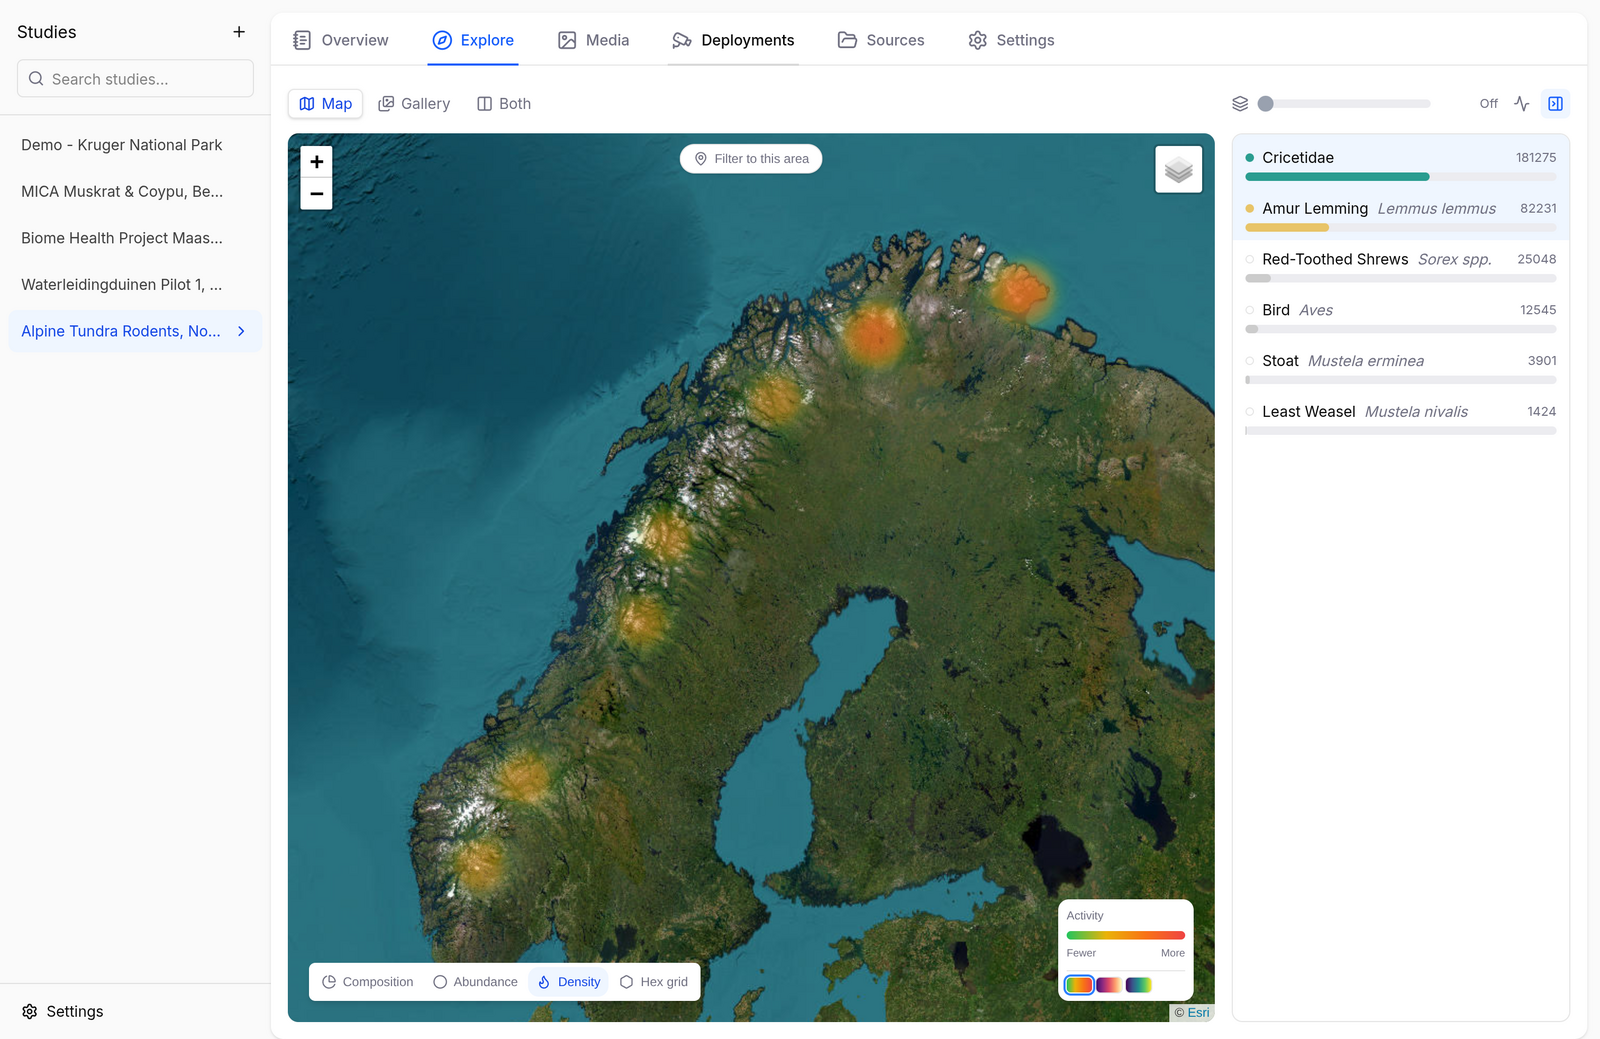
- Map — camera locations rendered as pie charts (species composition), or switch the encoding to abundance, density, or a hex grid. Click Filter to this area to restrict everything to the current map view.
- Gallery — the images behind the current selection, newest first.
- Activity charts — toggle the chart row (activity icon, top right) to add a daily-activity clock and a seasonal timeline. Charts can be normalized per species to compare activity patterns between abundant and rare species.
Map Encodings
Besides species composition, the map offers an abundance encoding (marker size scales with the number of observations) and a density heatmap (where the selected species concentrate):
Hovercards
Hover over a species in the rail to get a rich species card: a representative photo from the study, daily activity clock, seasonal timeline, and a short description with a link to the IUCN Red List assessment.
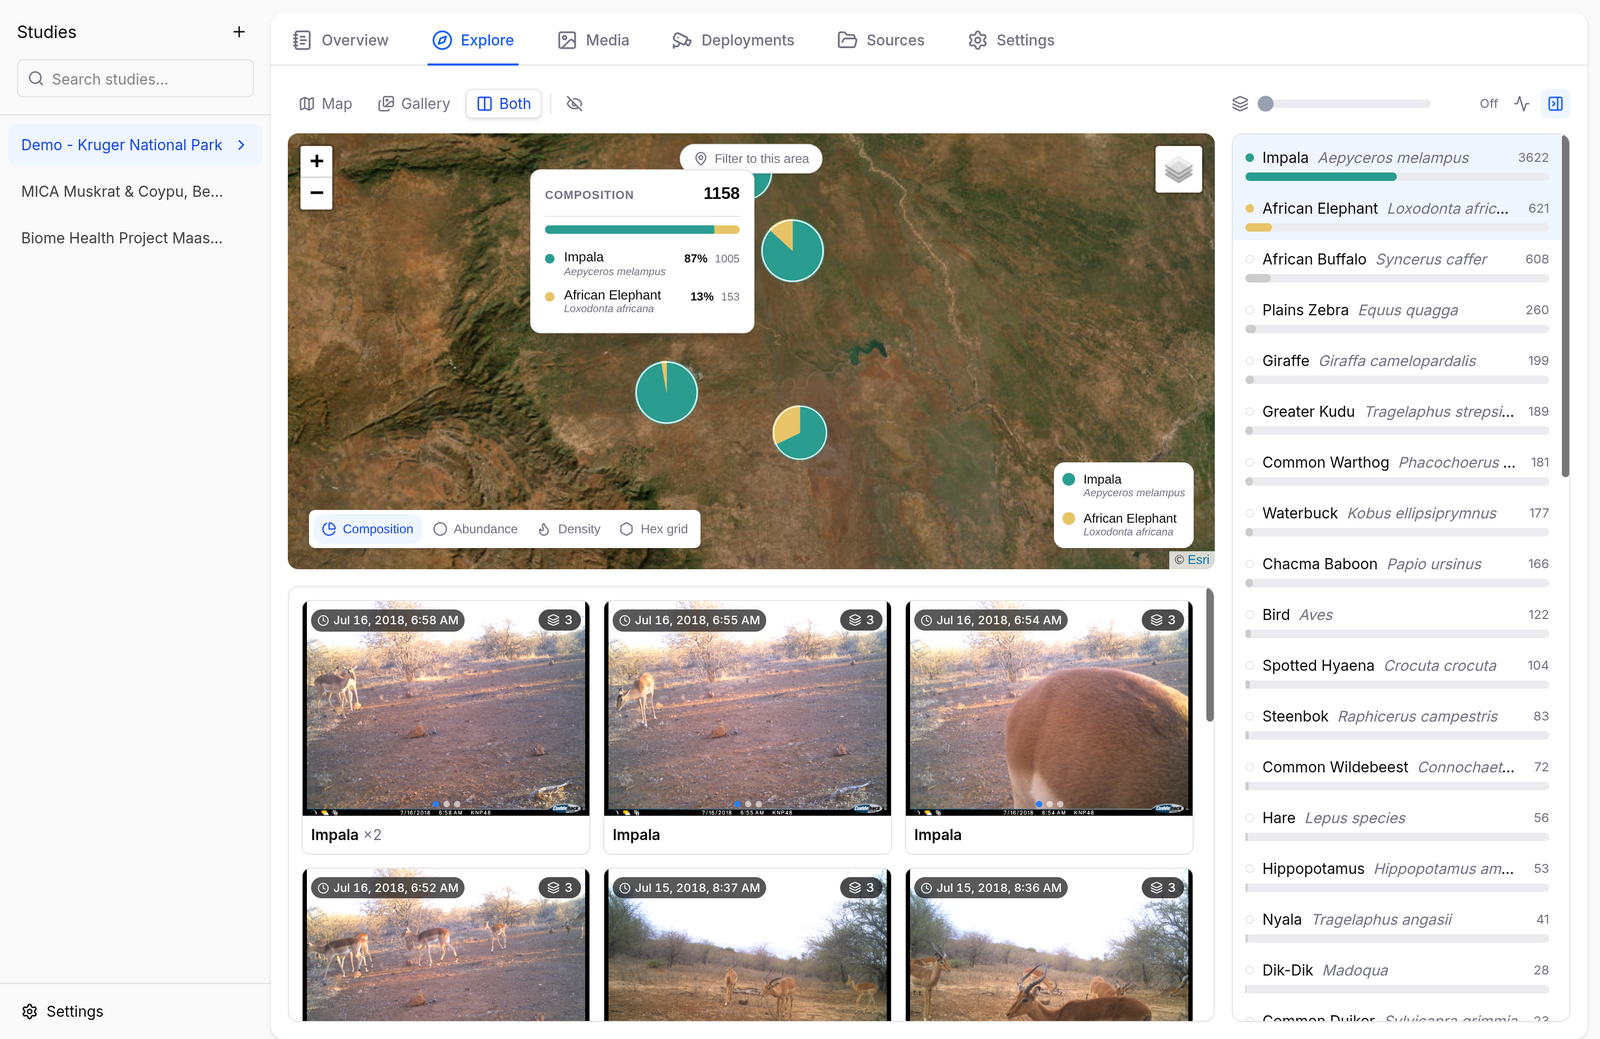
Hover over a map marker to see the composition behind it — total observations at that camera and the share per selected species.
Media
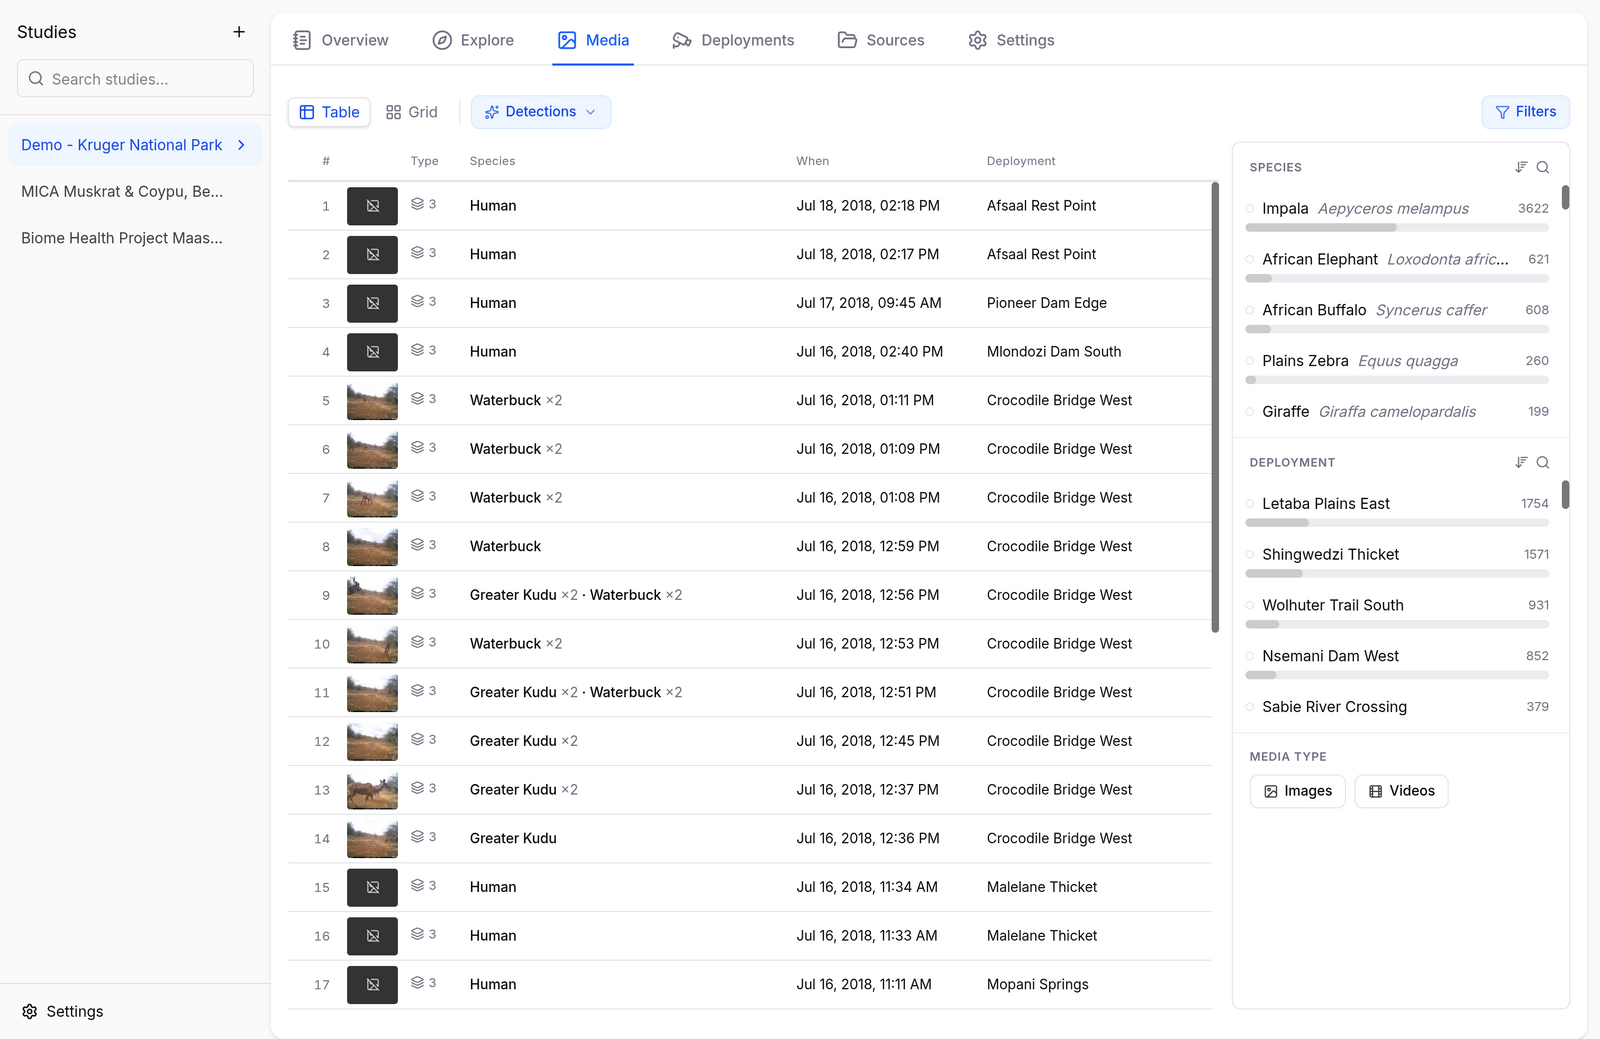
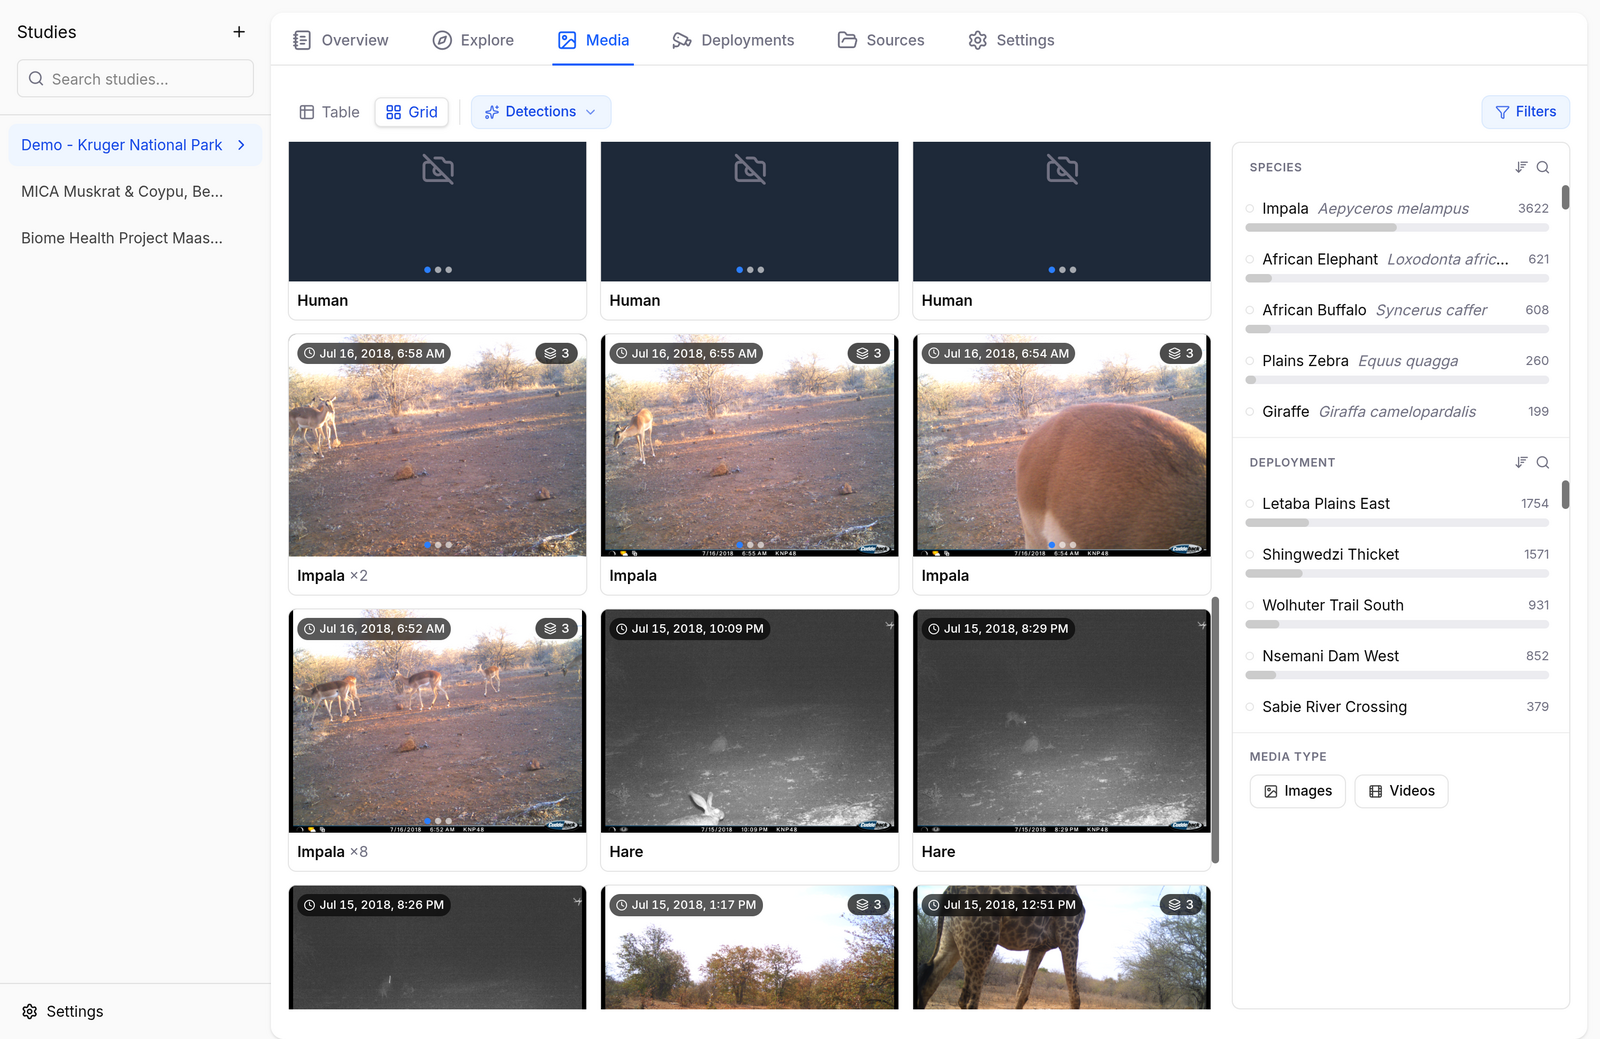
The Media tab lists every image and video in the study, as a sortable Table or a thumbnail Grid. The rail on the right filters by species, deployment, and media type; the Detections dropdown filters by what the AI or annotators found; Filters opens date and time-of-day controls.
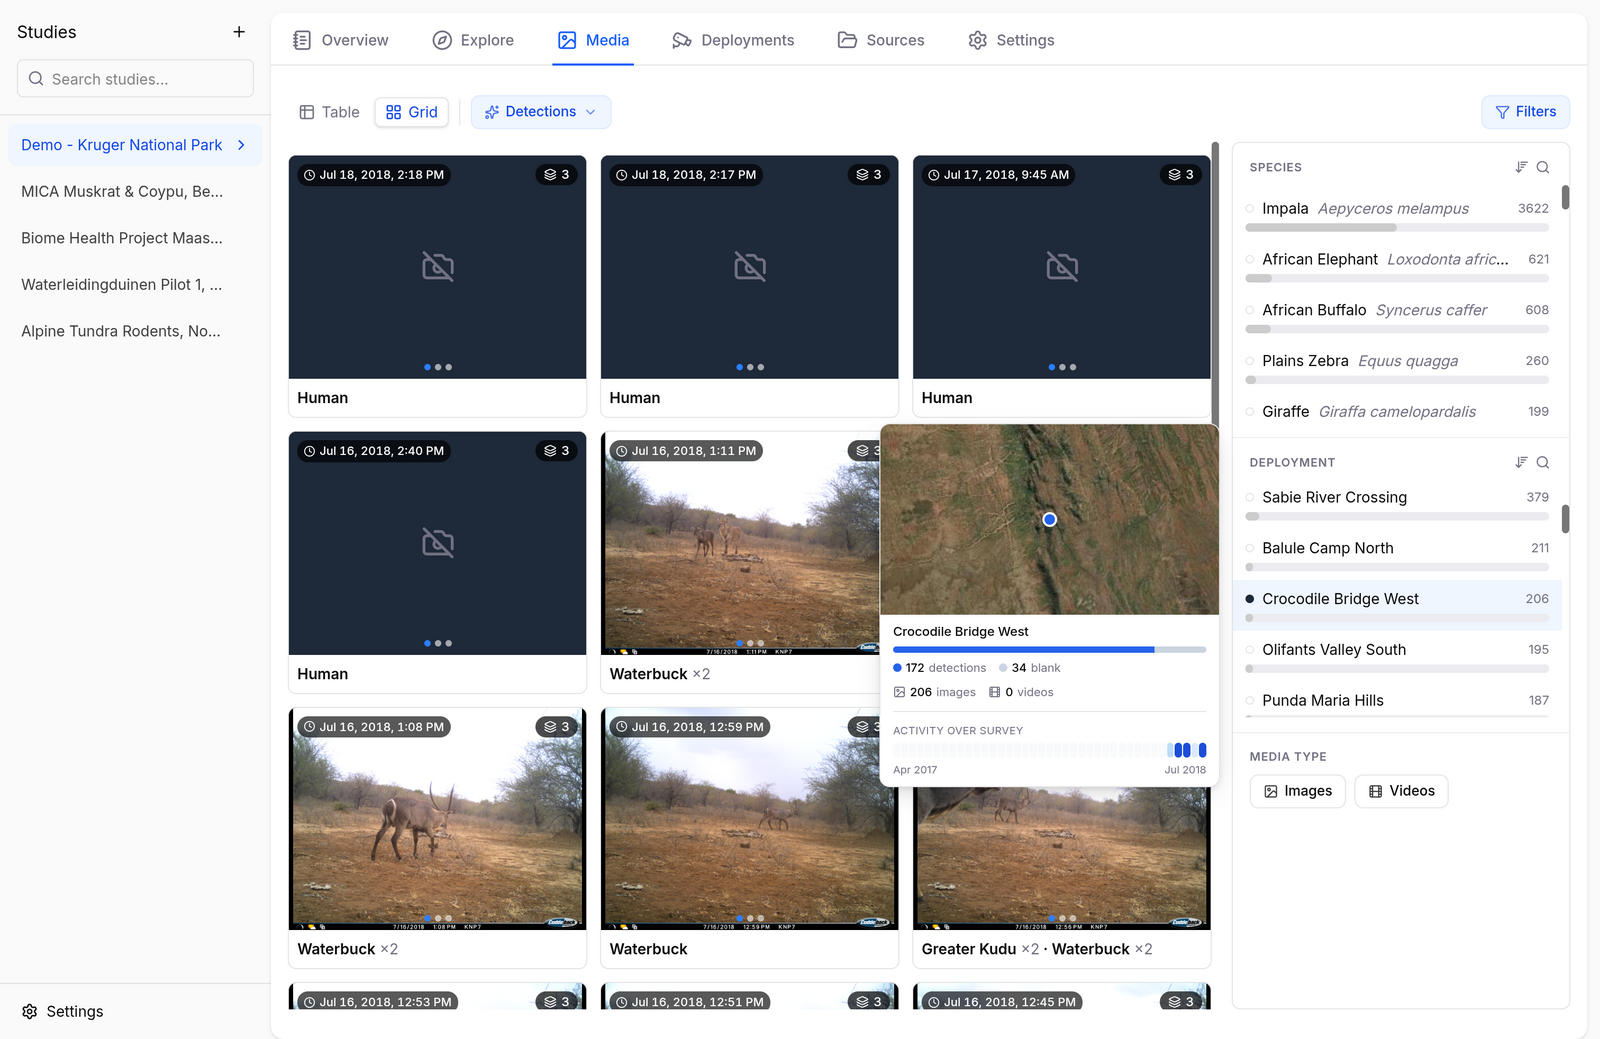
The rail has hovercards too: hover a deployment to see where the camera sits and what it captured — detections, media counts, and its activity over the survey:
Quick Views and Favorites
The Quick views dropdown in the toolbar jumps to common slices of the study in one click:
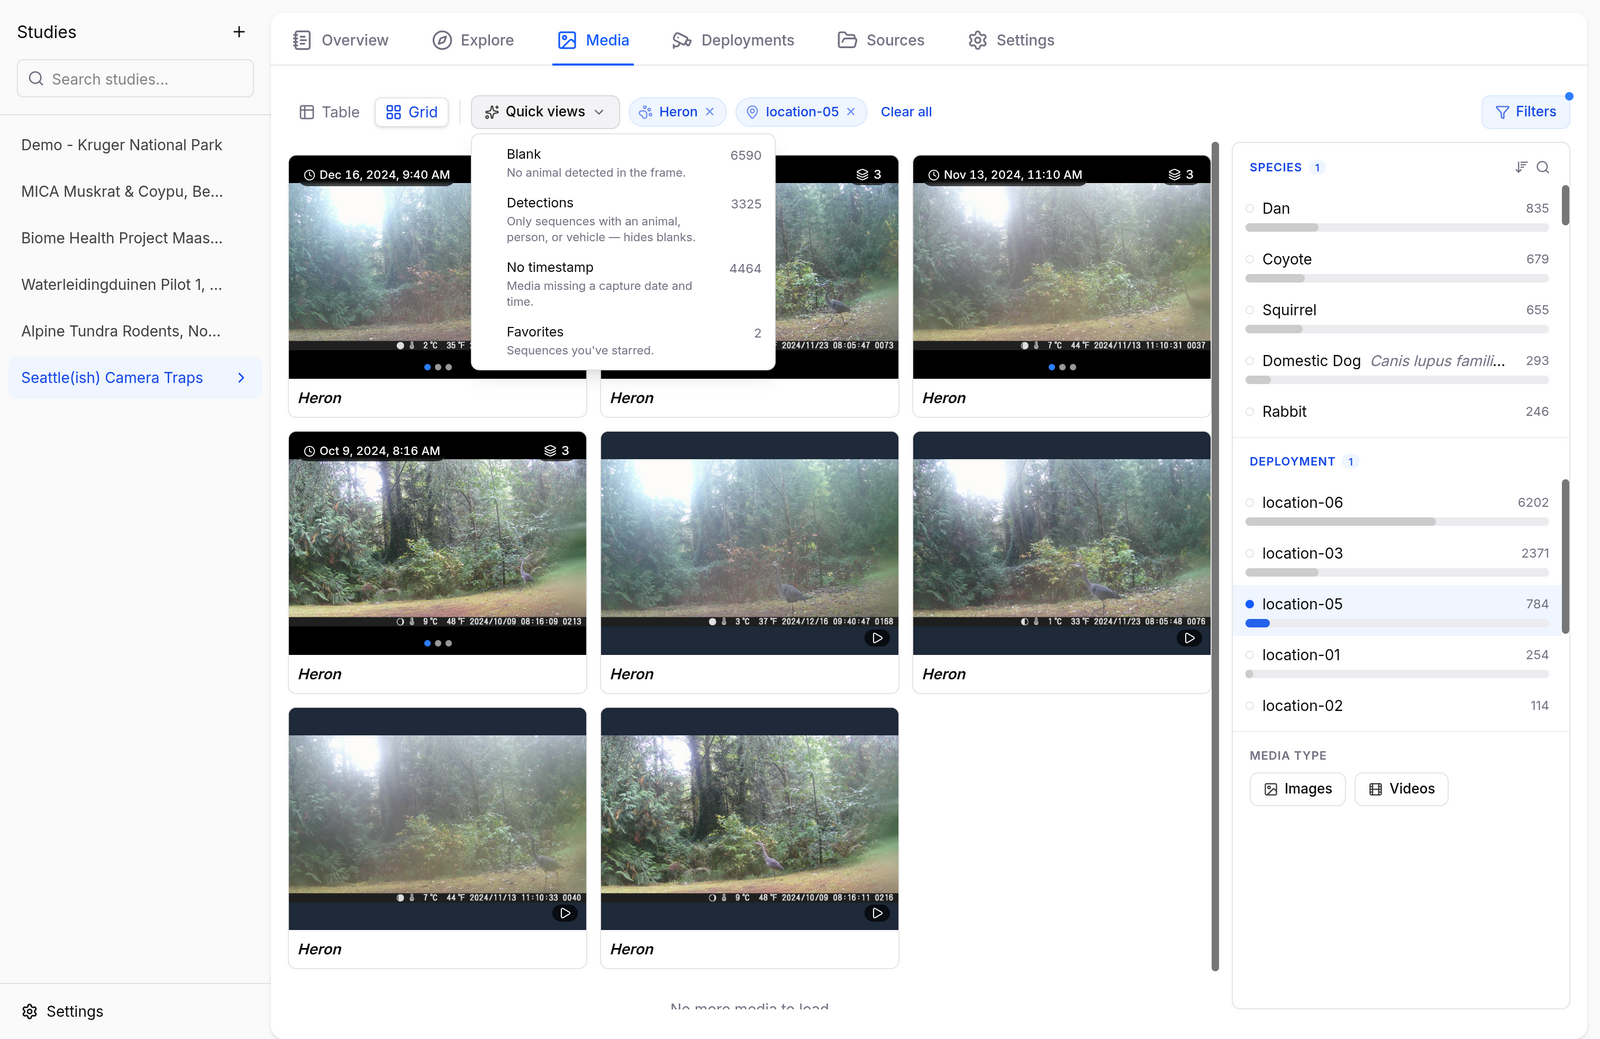
- Blank — media where nothing was detected (handy for spotting missed animals).
- Detections — only media with at least one animal, person, or vehicle.
- No timestamp — media missing a capture date and time.
- Vehicle — vehicle detections.
- Favorites — everything you've marked with the heart button in the gallery viewer.
Favorites are the lightweight way to collect highlights — heart a capture in the viewer and it joins the Favorites view, ready to revisit or export:
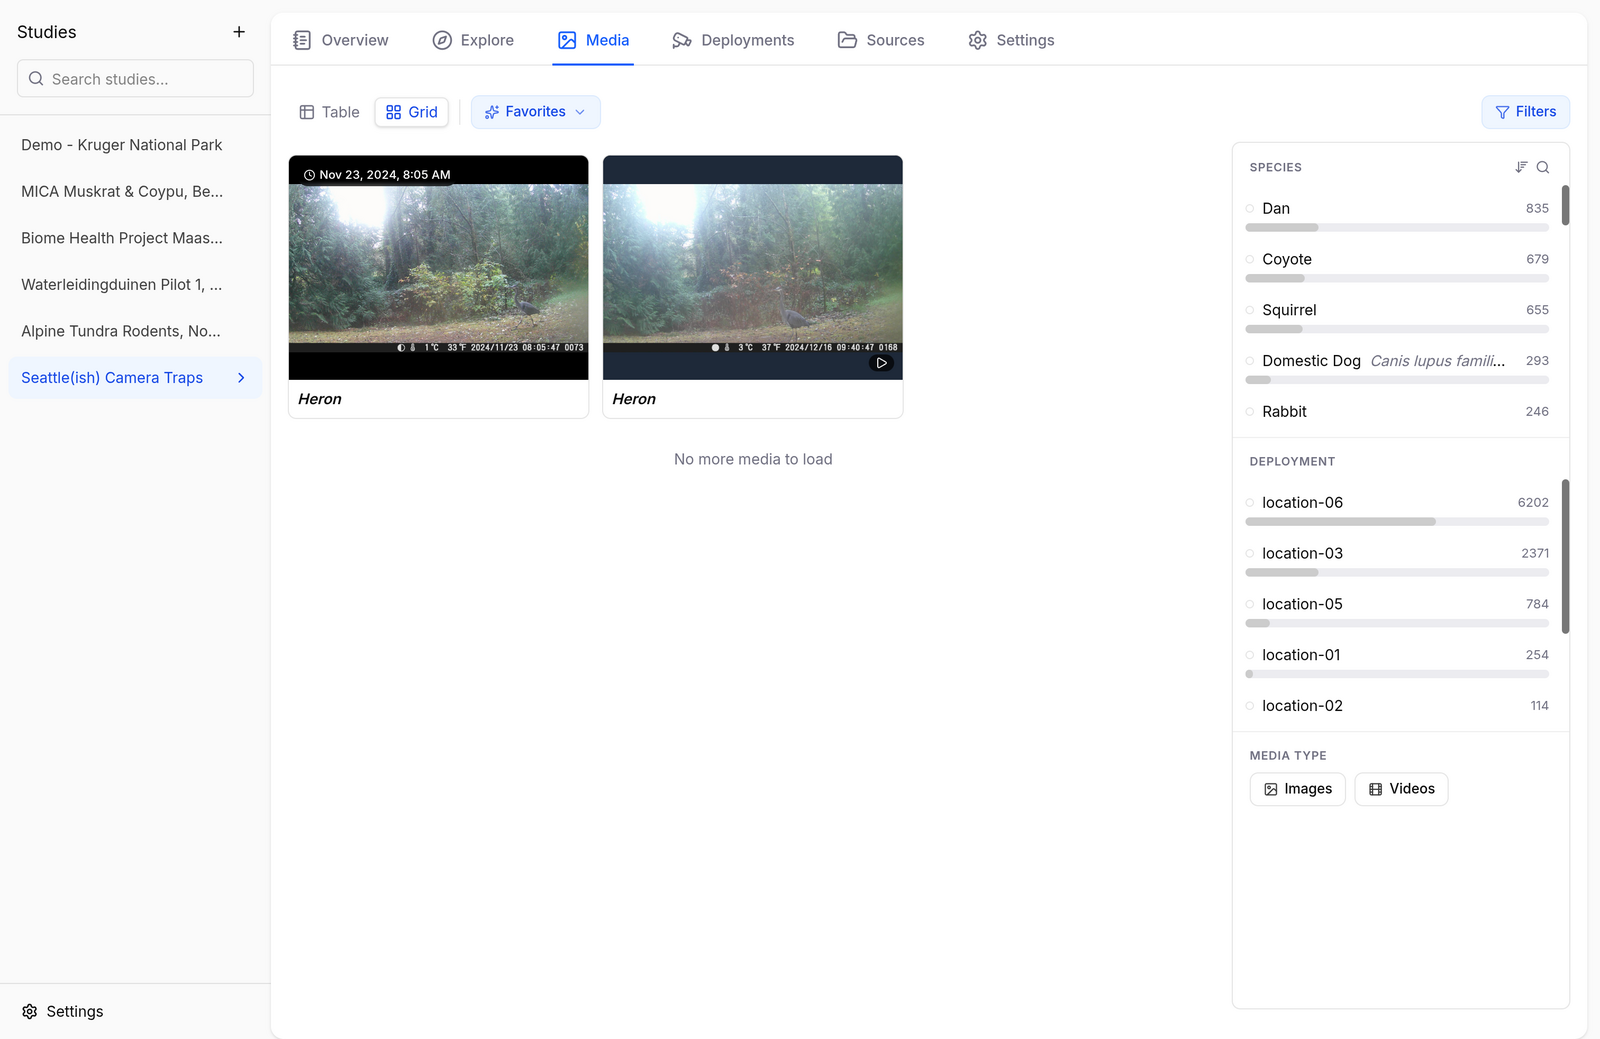
Click any media item to open the full-screen viewer — see Annotating Images. Videos get a full player — see Working with Videos.
Deployments
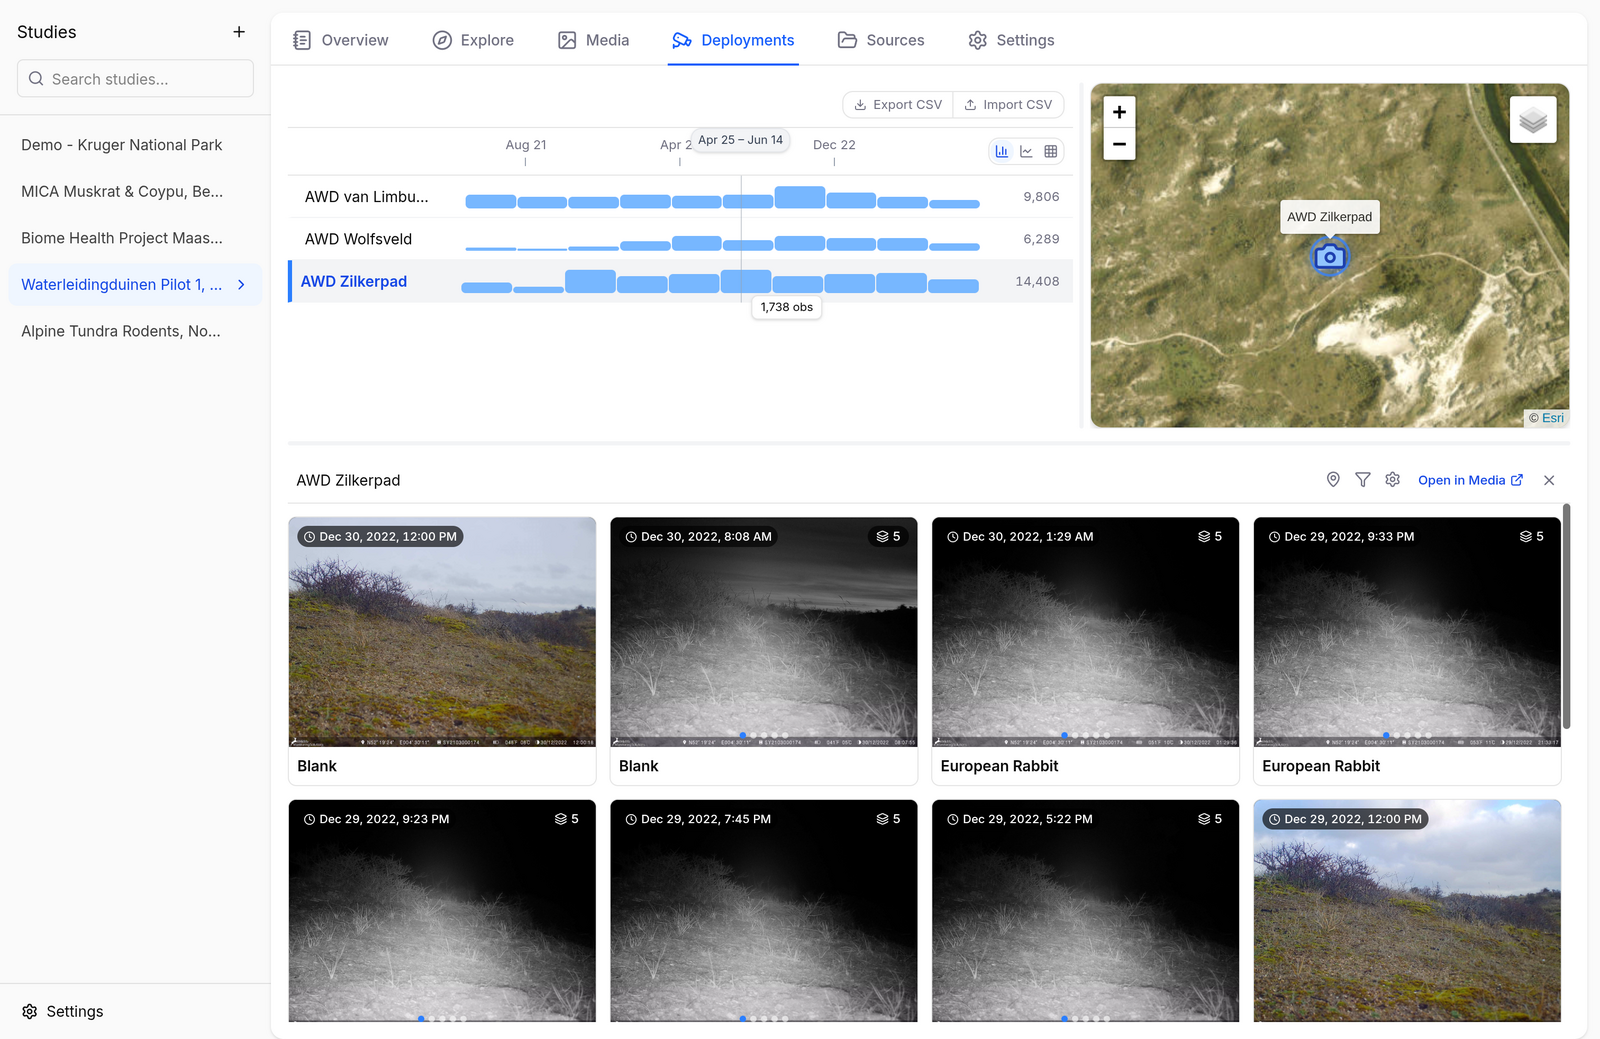
The Deployments tab shows when each camera was active: one timeline row per deployment, next to a map of the deployment locations. Deployment metadata can be exported and re-imported as CSV — useful for fixing coordinates or names in bulk.
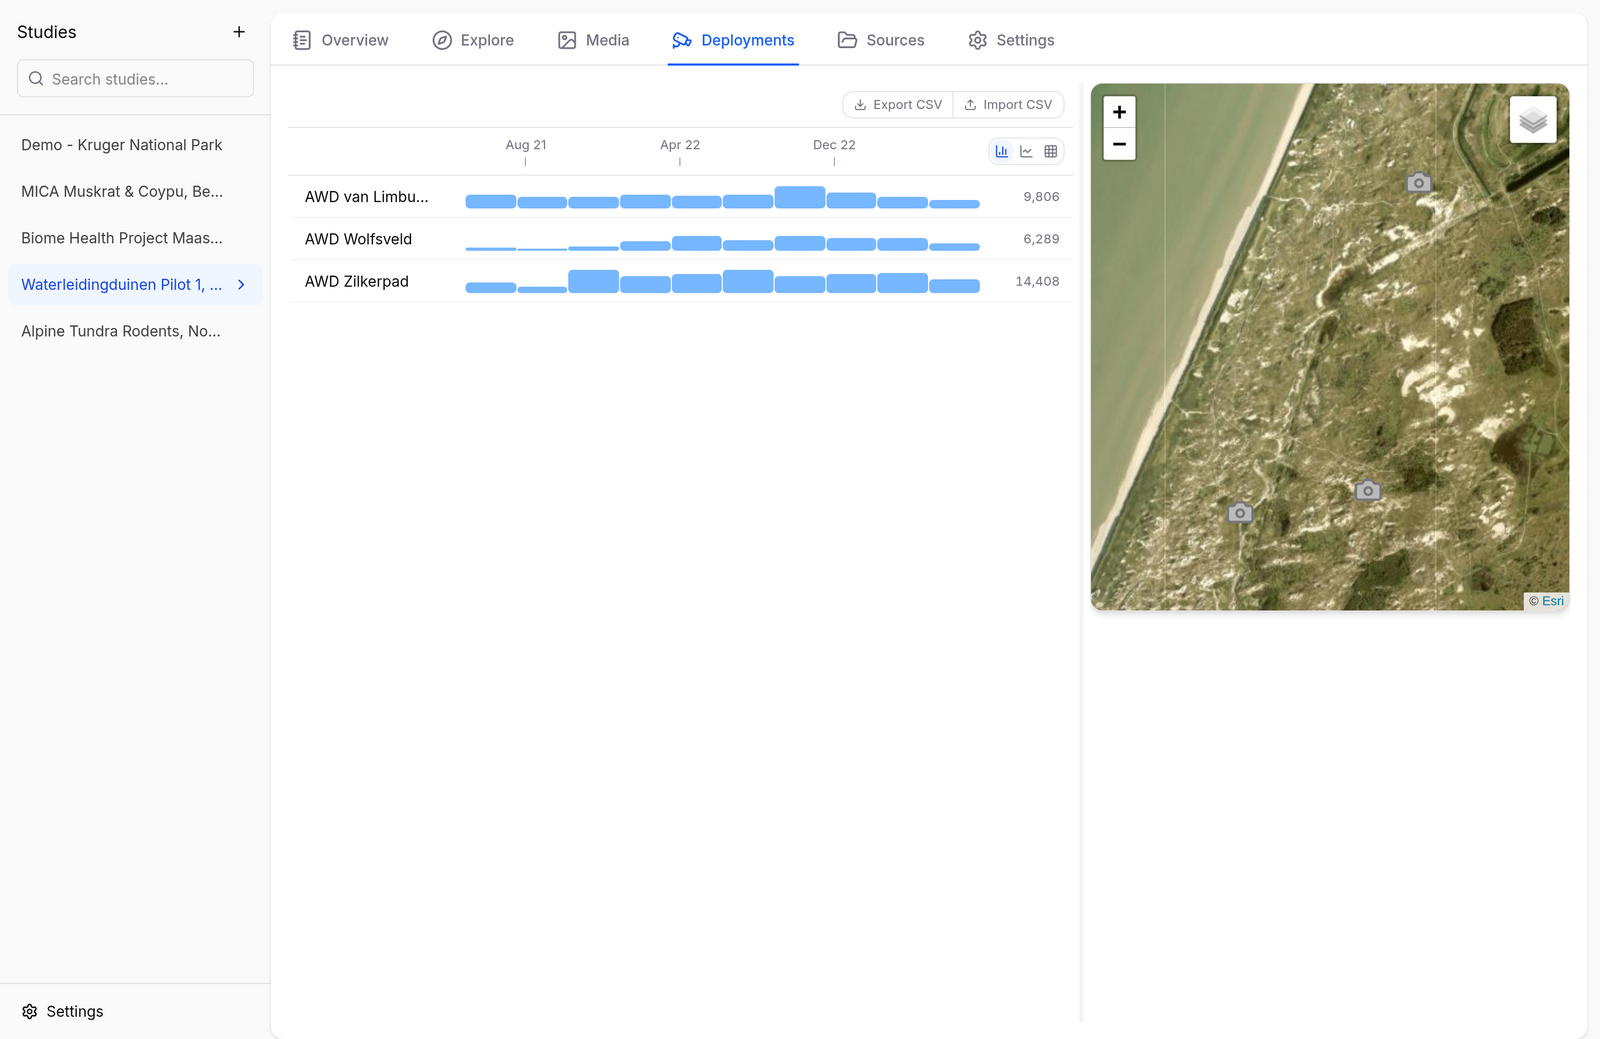
The toggle above the timelines switches how activity is drawn — bars (taller = more captures), a smooth line, or a heatmap (darker = more captures):
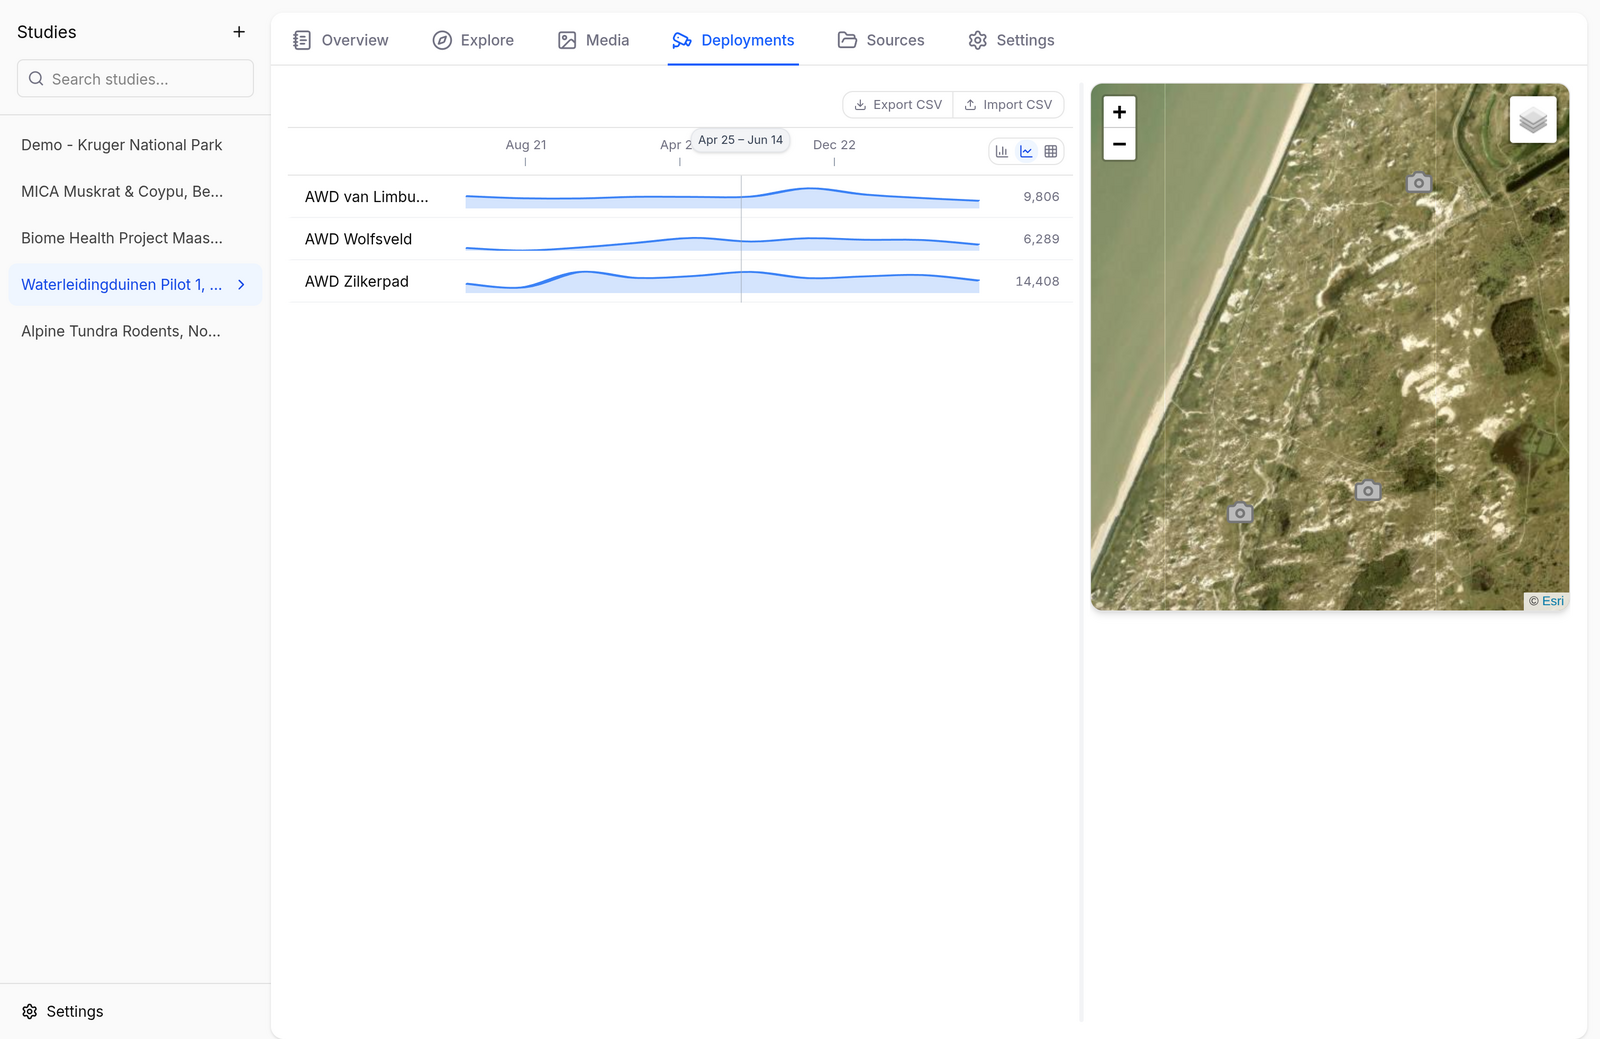
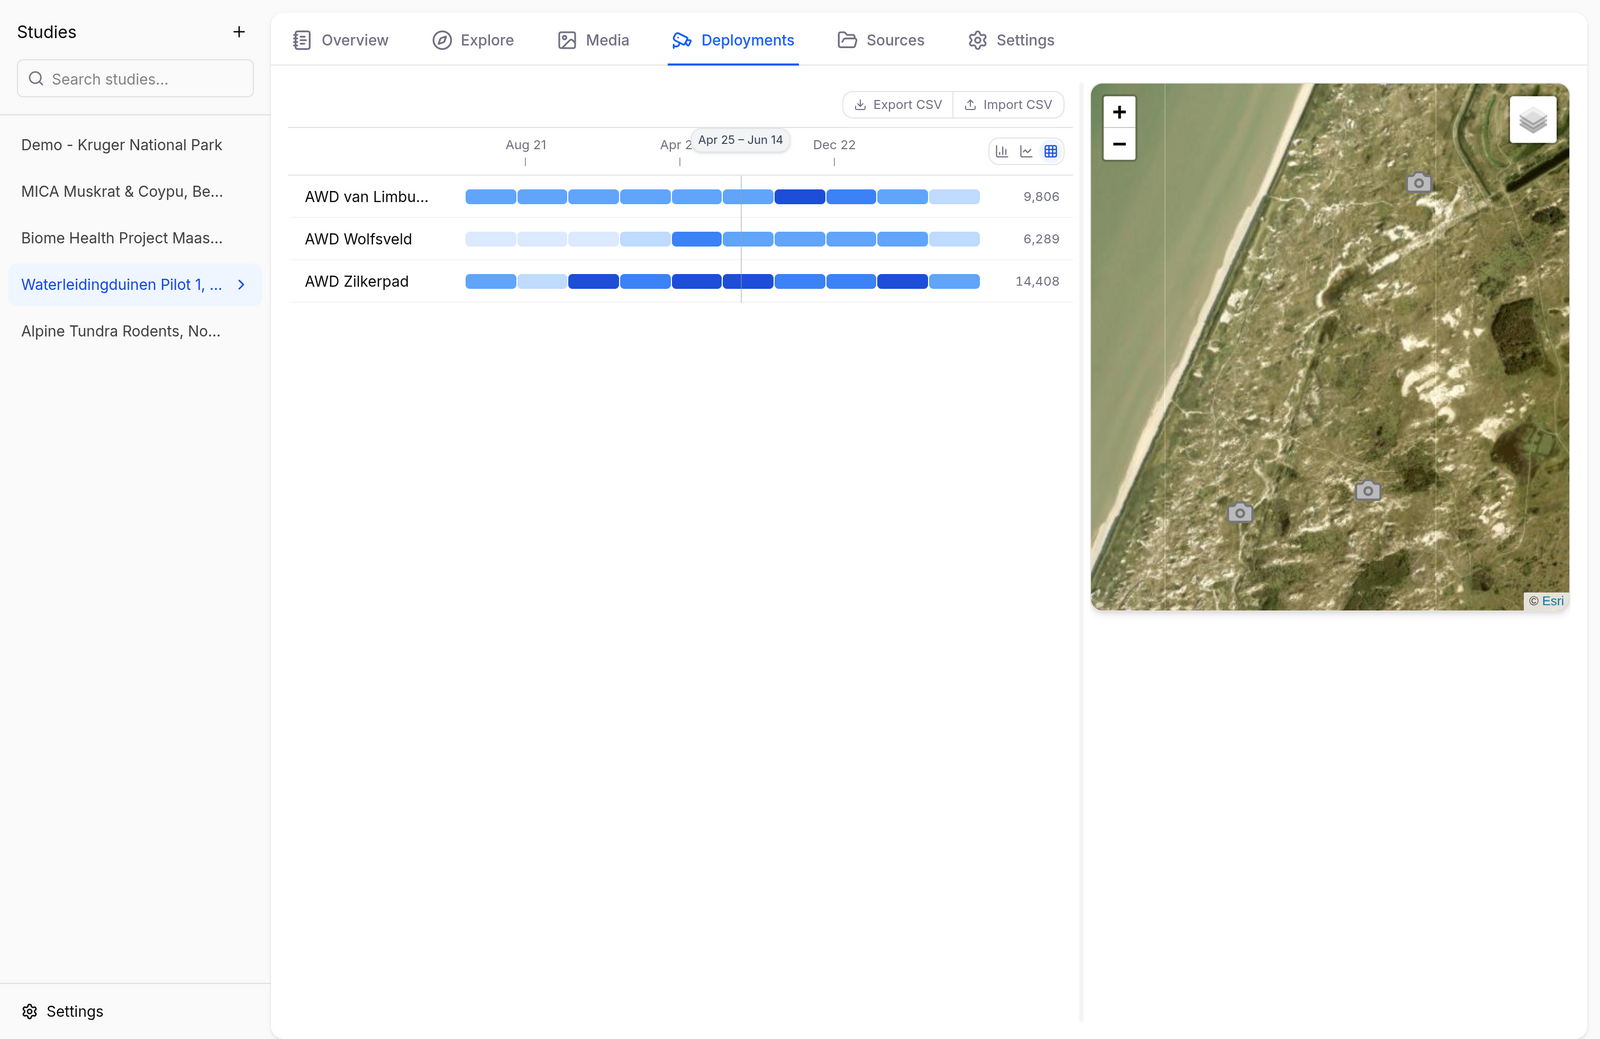
Click a deployment's timeline to open its detail pane: the camera's media gallery, its highlighted position on the map, and a direct link into the Media tab. Drag on the timeline to restrict the gallery to a date range.
Sources
The Sources tab lists where the study's media files come from — local folders, remote servers, or other studies merged in — and how many files each source contributes. Use + Add source to scan an additional images folder or merge another study (see Importing Data).
Sequence Grouping
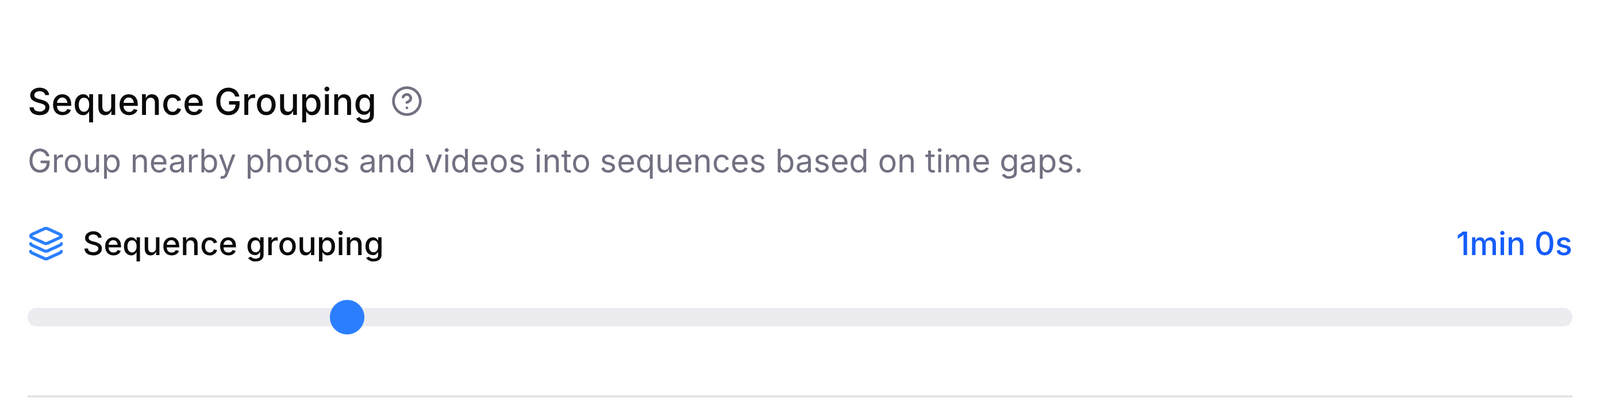
Camera traps fire in bursts: one animal walking past can produce dozens of near-identical photos. Counting each photo as an observation would wildly inflate the numbers, so Biowatch can group media into sequences.
You choose a time gap (in study Settings, or with the slider at the top of the Explore species rail). Captures from the same camera that are closer together than the gap belong to the same sequence, and each sequence counts as a single event in the charts and statistics. Within a sequence, the species count is the largest number of individuals seen together in any one frame — so an impala photographed 20 times in a burst counts once, but a frame showing three impala counts as three.
Studies imported from Camtrap DP may already carry event groupings (eventID); these are preserved and used when sequence grouping is off.
Explore offers four analysis metrics:
- N ind. (Individuals) — for each sequence, take the largest number of same-species detections in one frame, then sum those maxima. This is not a unique-animal or population estimate: an animal can contribute again in another sequence.
- N obs. (Independent observations) — count each sequence in which the species appears once, regardless of the number of frames or detections in that sequence.
- RAI ind. (Individual relative abundance index) — N ind. per 100 effective camera-days.
- RAI obs. (Observation relative abundance index) — N obs. per 100 effective camera-days. This is the more conventional camera-trap encounter-rate index.
RAI uses deployment start-to-end duration as camera effort. Partial days remain fractional, multiple cameras contribute separately, and date, area, and time-of-day filters clip both detections and effort. A deployment contributes only when both dates are valid and its end follows its start. Biowatch assumes the camera operated continuously inside that interval; represent known downtime as separate deployment intervals. Media without a valid timestamp and valid deployment attribution are excluded from RAI numerators. When no valid effort exists, RAI is shown as unavailable rather than zero.
RAI is an encounter-rate index, not an estimate of unique animals, population size, density, occupancy, or detection probability. It does not control for camera placement, habitat, species detectability, bait, or camera settings. Prefer standardized within-study comparisons and report the sequence-gap and effort rules with results.
The current N ind. calculation uses the number of observation records on each media item. An aggregate Camtrap DP observations.count value stored on one record is not yet expanded, so a single imported record with count = 5 currently contributes one to N ind. N obs. is unaffected because it only records species presence in the sequence.
Settings
The study Settings tab covers:
- Sequence Grouping — the default time gap used to group this study's media into sequences (see above).
- Export — media directories or a Camtrap DP package (see Exporting & Sharing).
- Cache — transcoded videos, thumbnails, and remote images cached on disk; clear any time, they regenerate on demand.
- Danger Zone — delete the study from Biowatch. Your original images and videos on disk are never touched.